
Mean and Median – In its most common sense, methodology is the study of research methods. However, the term can also refer to the methods themselves or to the philosophical discussion of associated background assumptions. A method is a structured procedure for bringing about a certain goal, like acquiring knowledge or verifying knowledge claims. This normally involves various steps, like choosing a sample, collecting data from this sample, and interpreting the data. The study of methods concerns a detailed description and analysis of these processes. It includes evaluative aspects by comparing different methods.
In this way, their benefits and drawbacks are evaluated, as well as the research goals for which they may be used. These descriptions and evaluations are predicated on philosophical background assumptions; examples include how to conceptualize the phenomena under study and what constitutes evidence in favor of or against them. In its broadest sense, methodology encompasses the discussion of these more abstract issues.
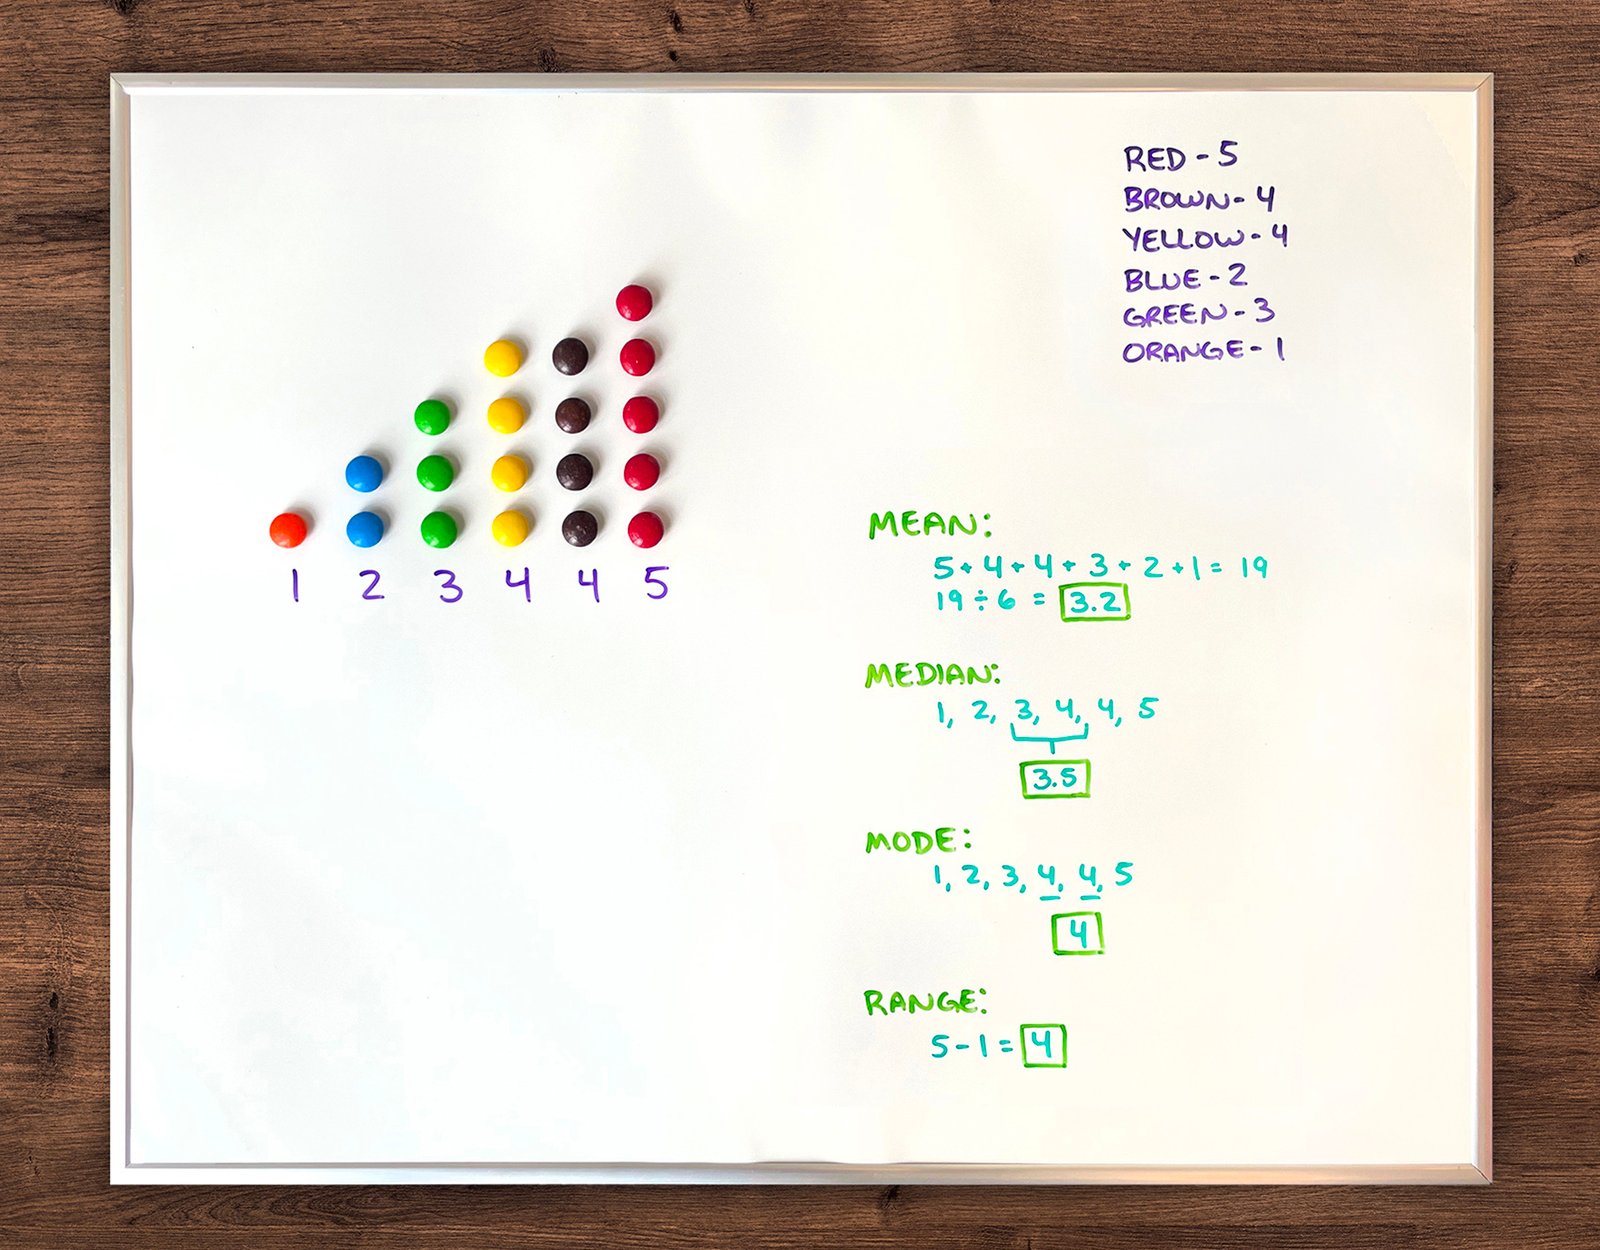
Mean and Median
Measures of central tendency:
Types of measure of central tendency: there are three main measures of central tendency. These are
➣Mean
➣Median
➣Mode
1. Mean: the mean is the average of all numbers and is sometimes cause the arithmetic mean. To calculate the mean, at together all of the numbers in a set and then divide sum by the total count of number. e.g. five servers assumes/consume 100 W, 98W, 105W, 90W and 102W of power.
Mean add numbers/count the given numbers (100+98+105+90+1020W)/5 = 99W per server.
2. Median: median is the middle number in sequence of numbers. To find the median number organized the number is ascending number. E.g. five servers consume 100W, 102W, 105W.. so the median is the middle number = 100W.
3. Mode: mode is the number that occurs most often within a set of numbers. e.g. 9 servers consume 90W, 104W, 98W, 98W, 105W, 98W, 110W, 98W, 102W, 98W. the mode is 98W ; the number which occurs most often.
Classification of mean:
Types of mean: there are several types of means. The most common means are,
1. Arithmetic mean: a. simple mean b. weighted mean
2. The geometric mean
3. The harmonic mean
[Ref: Z.H.S 1/45]
Objectives of measuring central tendency:
There are two main objectives of central tendency.
1. To find out one single value that describes the characteristics of entire sets of data. Measuring of central value by condensing the mass of data in one single value enable us to get an idea of the entire sets of data. It is representative value of whole sets of data.
2. To facilitate comparison-measures of central tendency central tendency enable us making comparison. Comparison can be made at a point of time or over period of time.
[Ref: Dr. Md. ZHS 1″/44]
a. Mean:
The mean is defined as the average of all numbers and is sometimes cause the arithmetic mean. To calculate the mean, at together all of the numbers in a set and then divide sum by the total count of number.
Example: five servers assumes/consume 100 W, 98W, 105W, 90W and 102W of power. Mean add numbers /count the given numbers (100+98+105+90+1020W)/5 = 99W per server.
b. Median:
Median is defined as the middle number in sequence of numbers. To find the median number organized the number is ascending number.
Example: five servers consume 100W, 102W, 105W. So the median is the middle number = 100W.
c. Mode:
Mode is defined as, the number that occurs most often within a set of numbers.
Example: 9 servers consume 90W, 104W, 98W, 98W, 105W, 98W, 110W, 98W, 102W, 98W. The mode is 98W; the number which occurs most often
(Ref-K. Park/24)
Measurement of Central Tendency:
1. Median:
A. Calculating ODD number of data:
➤ Step: I-Count the total numbers.
- Example: 4, 5,7,2,1 (ODD). There are five numbers in the distribution.
➤ Step: 2- Arrange the number in ascending order.
- Example: 1.2.4.5.7
➤Step: 3- The total elements in the distribution (5) is odd or number. The middle position can be calculated using the formula (n+1)/2 So, the middle position is (5+1)/26/2-3. The number at 3 position is Median – 4.
B. Calculating the even number of data:
➤ Step: 1- Count the total number given.
- Example: 4, 5, 7,2,1,8. There are 6 elements or numbers in the distribution.
➤Step: 2- Arrange the numbers in ascending order.
- Example: 1, 2, 4,5,7,8
➤ Step: 3- The total elements in the distribution (6) is even. As the total is even We have to take average of number at n/2 and (n/2) +1 So, position are n/2 = 6/2=3 • The number at 3 and 4th position are 4,6
➤ Step: 4-Find the median.
- The average is (4+5)/2= Median 9/2-4.5
2. Mode:
The calculating mode numbers
➤ Step: 1- Write the numbers in data set.
➤ Step: 2- Order the numbers from smallest to largest or in ascending order.
➤ Step: 3- Count the number of times each number is repeated.
- Example: 7 boys got numbers in mathematics: 71,68,71,72,65,71,80
- Arrange the number in ascending order.
- 65,68,71,71,71,72,80.
- Here the repeated number = 71 Mode.
3. Mean:
Calculating the mean number of data
➤Step: 1- Arrange the number and write.
- Example: 34,21,5,1,19,6,11,5,3,8
➤ Step: 2- Add up all of your numbers:
- Example: 1+5+6+8+3+5+11+19+21+34-113
➤Step: 3-Count the number of items in your set. There are 10 numbers in the set: 1,5,6,8,8,3,5,11,19,21,34
➤ Step: 4- Divide the number calculated in step 2 by the total number = (10) that is found in step 3.
- Mean -113/10
➤The mean for this data set is 11.3.
[Ref-K. Park/24]
Arithmetic mean:
Arithmetic mean is the sum of all observations divided by the number of observations. Symbolically an arithmetic mean is denoted by X (x bar). Suppose ages of 5 students are 20,22,23,25 and 20years. So arithmetic mean,

[Ref-Dr Md.Z.H.S. 1″/45]
Merits and demerits of arithmetic mean
Merits:
➤ It is rigidly defined.
➤ It is easy to calculate and simple to follow. It is based on all the observations.
➤It is determined for almost every kind of data.
➤It is finite and not indefinite.
➤It is readily put to algebraic treatment.
➤It is least affected by fluctuations of sampling.
Demerits:
➤ The arithmetic mean is highly affected by extreme values.
➤ It cannot average the ratios and percentages properly.
➤ It is not an appropriate average for highly skewed distributions.
➤It cannot be computed accurately if any item is missing.
➤The mean sometimes does not coincide with any of the observed value.
➤It can be located graphically.
➤ It cannot be calculated for qualitative data.
[Ref.Lecture of BNC]


Frequency distribution
The variable under study can have values, some of which may be common and the others may be different. If the values are arranged in order of magnitude along with their number of occurrences we get a frequency distribution.
Construct a frequency distribution table:
1). Find the range of the data: the range is the difference between the largest and the smallest values,
2) Decide the approximate number of classes: which the data are to be grouped. most of the cases we have 5 to 20 classes.
3) Determine the approximate class interval size: the size of class interval is obtained by dividing the range of data by number of classes & denoted by class interval size.
(h) = Range / Numbber of Classes
4) Decide the starting point: the lower class limits or class boundary should cover the smallest value in the raw data. It is a multiple of class interval. For example: 0, 5,10,15,20 etc. are commonly used.
5) Determine the remaining class limits (boundary): when the lowest class boundary of the lowest class has been decided, then by adding the class interval size to the lower class boundary computer the upper class boundary.
6) Distribute the data into respective classes: All the observations are marked it respective classes by using tally gars (Tally marks) methods which is a suitable for tabulation the observations into respective classes.
Or,
1. The class or group interval between the groups should not be too broad r too narrow.
2. The number of groups or classes should not be too many or too few but be ordinarily between 6 and 16 depending on the details necessary and size of the sample.
3. The class interval should be the same throughout.
4. the heading must be clear such as height in inches or cm.
5. The rates and proportions, if given the actual number the group must also be noted.
6. Groups should be tabulated in ascending or descending order.
7. If certain data are omitted or excluded deliberately, the reasons for the same should be given.
[Ref. Lecture of BNC]
Dispersion:
The dispersion of a set of observations refers to the magnitude of the differences they exhibit among them. A measure of dispersion conveys information regarding the extent of variability present in a set of data. Dispersion means scattering of values of the variable. It measures the extent of variations of the observations.
Measures of dispersion:
There are several measures of variation of which the following are widely known:
1. The range.
2. The mean or average deviation.
3. The standard deviation.
4. The variance.
Absolute measures:
The absolute measures of deviation are s follows-
1. Range.
2. Inter quartile range.
3. Quartile deviation.
4. Mean deviation.
5. Variance.
6. Standard deviation.
7. Standard error of mean and
8. Standard error of proportion.
Relative measures:
The relative measures of deviation are as follows-
1. Coefficient of mean deviation.
2. Coefficient of quartile deviation.
3. Coefficient of variation.