
MS EXCEL – This book covers the entire syllabus of “Computer & Information Technology” prescribed by the BNMC for B.Sc. in Nursing Science & Diploma in Nursing Science & Midwifery students. We tried to accommodate the latest information and topics.
This book is an examination setup according to the teachers’ lectures and examination questions. We hope in touch with the book students’ knowledge will be upgraded and flourished. The unique way of presentation may make your reading of the book a pleasurable experience.
MS EXCEL
Concept about MS EXCEL
Microsoft Excel is a spreadsheet developed by Microsoft for-
- Windows,
- Mac OS,
- Android and iOS.
It features calculation, graphing tools, pivot tables, and a macro programming language called Visual Basic for Applications. It has been a very widely applied spreadsheet for these platforms, especially since version 5 in 1993, and it has replaced Lotus 1-2-3 as the industry standard for spreadsheets. Excel forms part of Microsoft Office.
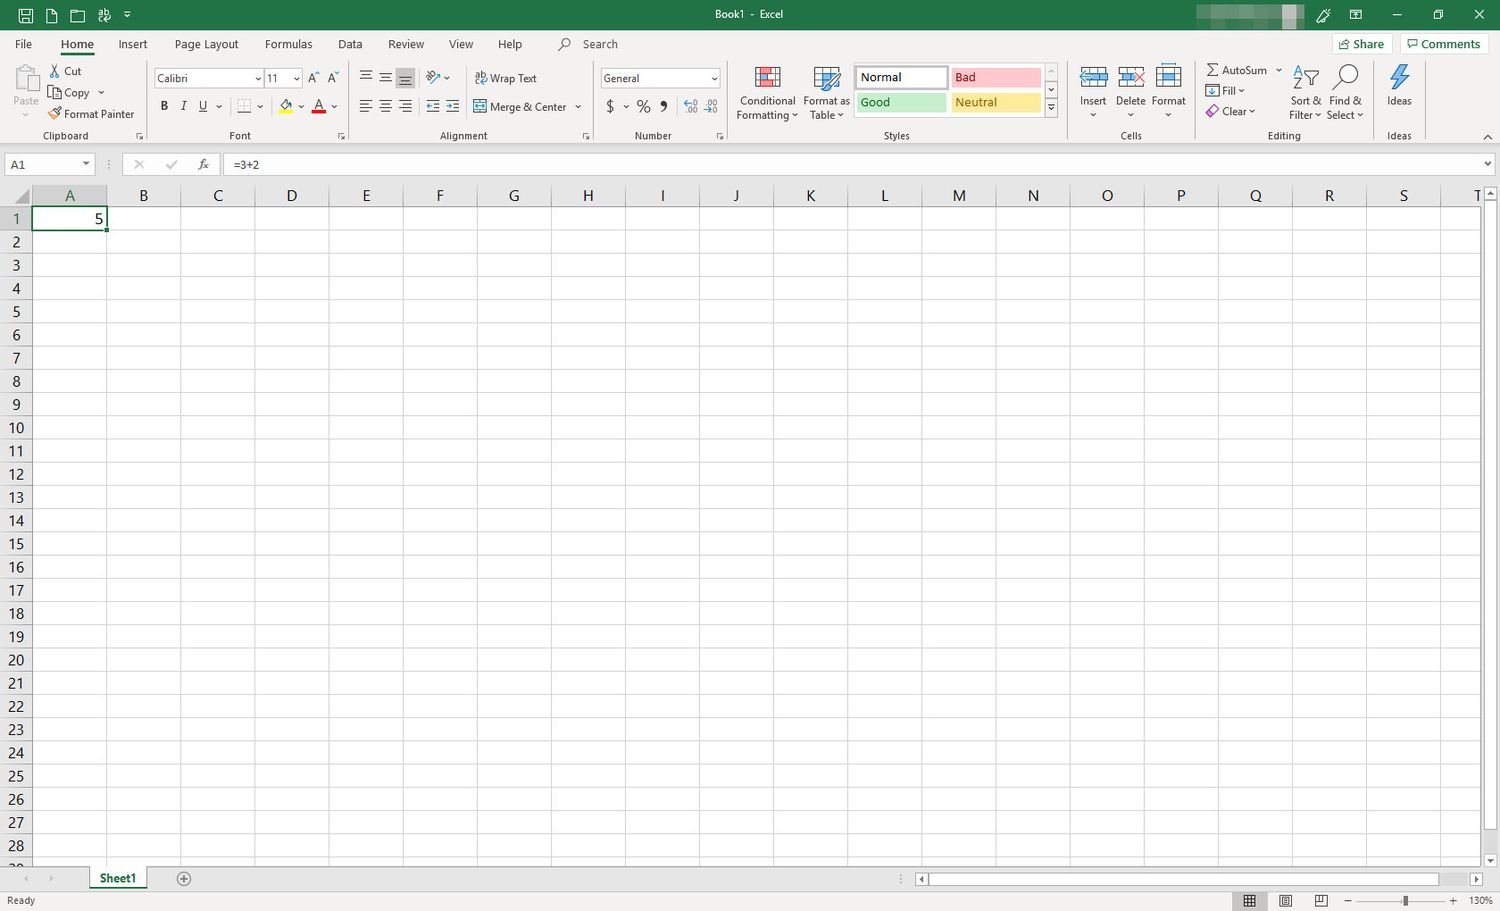
Figure: Ms Excel
Microsoft Excel was first released for Macintosh systems in 1985, followed by the first Windows version in 1987. The following is a list of Excel releases for Windows:
- Excel 2.0 (1987)
- Excel 3.0 (1990)
- Excel 4.0 (1992) – Included in Microsoft Office 3.0
- Excel 5.0 (1993) – Included in Microsoft Office 4.0
- Excel 95 (1995) – Included in Microsoft Office 95 Excel 97 (1997) – Included in Microsoft Office 97
- Excel 2000 (2000) – Included in Microsoft Office 2000
- Excel 2002 (2002) – Included in Microsoft Office XP
- Excel 2003 (2003) – Included in Microsoft Office 2003
- Excel 2007 (2007) – Included in Microsoft Office 2007.
- Excel 2010 (2010) – Included in Microsoft Office 2010
- Excel 2013 (2013) – Included in Microsoft Office 2013
Definition of Ms Excel:
Microsoft Excel is a software program produced by Microsoft that allows users to organize, format and calculate data with formulas using a spreadsheet system.
Or,
Microsoft Excel is a spreadsheet program included in the Microsoft Office suite of applications. Spreadsheets present tables of values arranged in rows and columns that can be manipulated mathematically using both basic and complex arithmetic operations and functions.
Or,
Microsoft Excel is a spreadsheet developed by Microsoft for
- Windows,
- Mac OS,
- Android and iOS.
It features calculation, graphing tools, pivot tables, and a macro programming language called Visual Basic for Applications.
Uses of MS-Excel:
There are many uses of MS Excel; the following uses of MS Excel are given bellow:
- Microsoft excel is an electronic spread sheet program that is used for entering, storing, organizing and manipulating data in a tabular form.
- It is usually used in performing a large variety of computations on the data.
- It is an electronic spreadsheet application used to display and operate numerical data.
- It features a number of applications such as calculation, graphing.
- It allows us to keep information in a table form.
- It is used to track progression and regression of trends such as in sales.
- It is handy when performing calculation. So Microsoft Excel is very important for calculating.
Function of MS-Excel:
A. Spreadsheets Function:
- Microsoft Excel has the ability to host huge spreadsheets up to one million rows by 16,000 columns.
- The data can be in a multitude of formats-numbers, data, text, general, currency, time.
B. Mathematical Function:
- There are over 50 math and trigonometry functions in excel.
- For example, Microsoft Excel can round numbers up and down, work with matrices.
C. Charts:
- Depending on your needs and data, Excel can create different charts for you. These include column, stock, surface, radar charts.
D. Pivot tables:
- Pivot tables let you quickly change how you view your data.
E. Macros:
- Macros allow users to create small custom programs to automate certain repetitive tasks.
F. Holding data:
- it is very useful for simple functions, like keeping track of addresses and phone
numbers.
There are some other functions which are mentioned bellow:
Database functions:
| Function | Description |
Database Average |
|
Data and time Functions:
| Functions | Description |
| Date |
|
Day, Hour, Month, Minute |
|
Financial Functions:
| Functions | Description |
| Present value |
|
| Rate |
|

Feature of Microsoft Excel:
1. Add Header and Footer: MS Excel allows us to keep header and footer in our
spreadsheet document.
2. Find and Replace Command: MS Excel allows us to find the needed data (text and
numbers) in the workbook and also replace the existing data with a new one.
3. Password Protection: It allows user to protect their workbooks by using password from
unauthorized access to their information.
4. Data Filtering: Filtering is a quick and easy way to find and work with a subset of data
in a range.
5. Data Sorting: Data sorting is the process of arranging data in some logical order. MS
Excel allows us to sort data either in ascending or descending order
6. Built in formulae: MS Excel has got many built-in formulae for sum, average,
minimum, etc. We can use those formulae as per our needs.
7. Create different charts (Pivot Table Report)
8. Automatically edits the result
9. Formula Auditing
Advantages of Microsoft Excel:
- Build great charts.
- Conditional Formating.
- Help identify trends.
- Bring data together.
- Analysis of large amount of data.
- Working together.
Disadvantages of Microsoft Excel
- Viruses
- System compatibility
- Steep learning curve
- Time consuming
- Graphs
Definition of Chart in Ms Excel:
In general, a chart is a graphic representation of data. Charts allow users to see what the results of data to better understand and predict current and future data.
Chart in MS Excel:
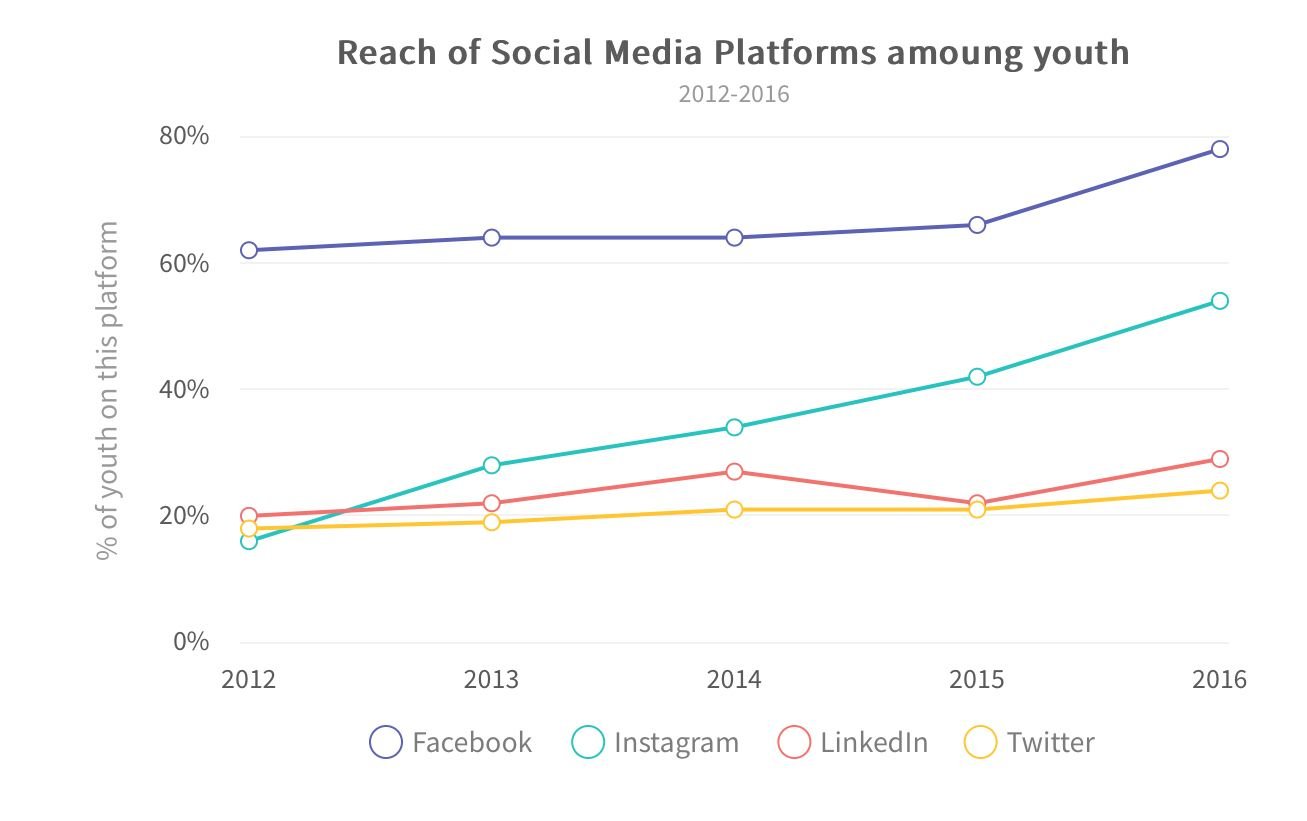
A. Line Chart: The line chart is one of the most frequently used chart types, typically used to show trends over a period of time. If you need to chart changes over time, consider using a line chart.
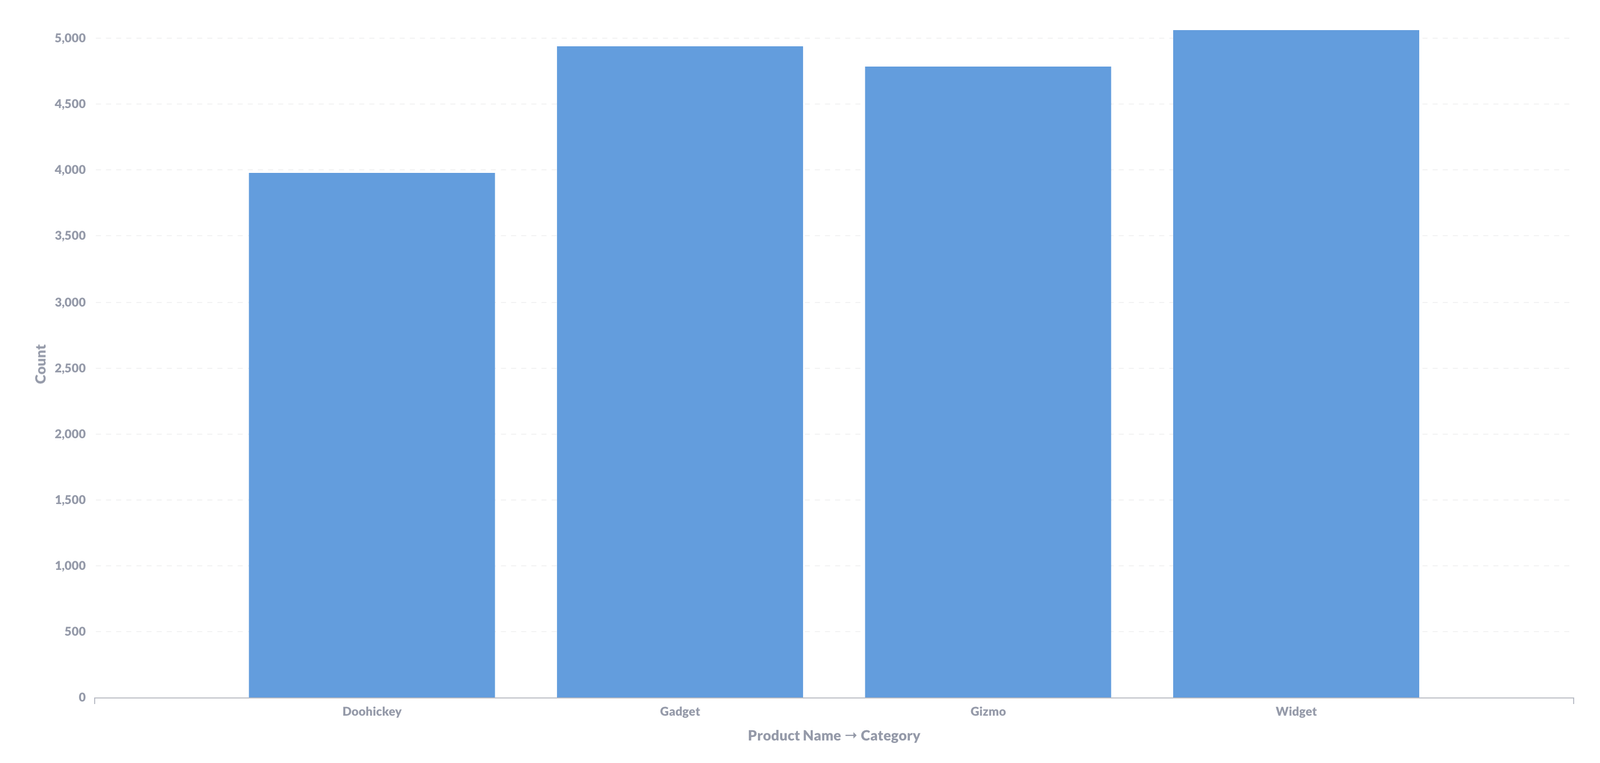
B. Column Chart: Column charts are typically used to compare several items in a specific range of values. Column charts are ideal if you need to compare a single category of data between individual sub-items, such as, for example, when comparing revenue between regions.

C. Clustered Column Chart: A clustered column chart can be used if you need to compare multiple categories of data within individual sub-items as well as between sub-items.

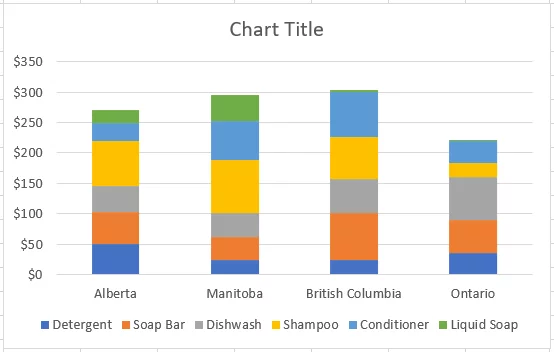
D. Stacked Column Chart: A stacked column chart allows you to compare items in a specific range of values as well as show the relationship of the individual sub-items with the whole.
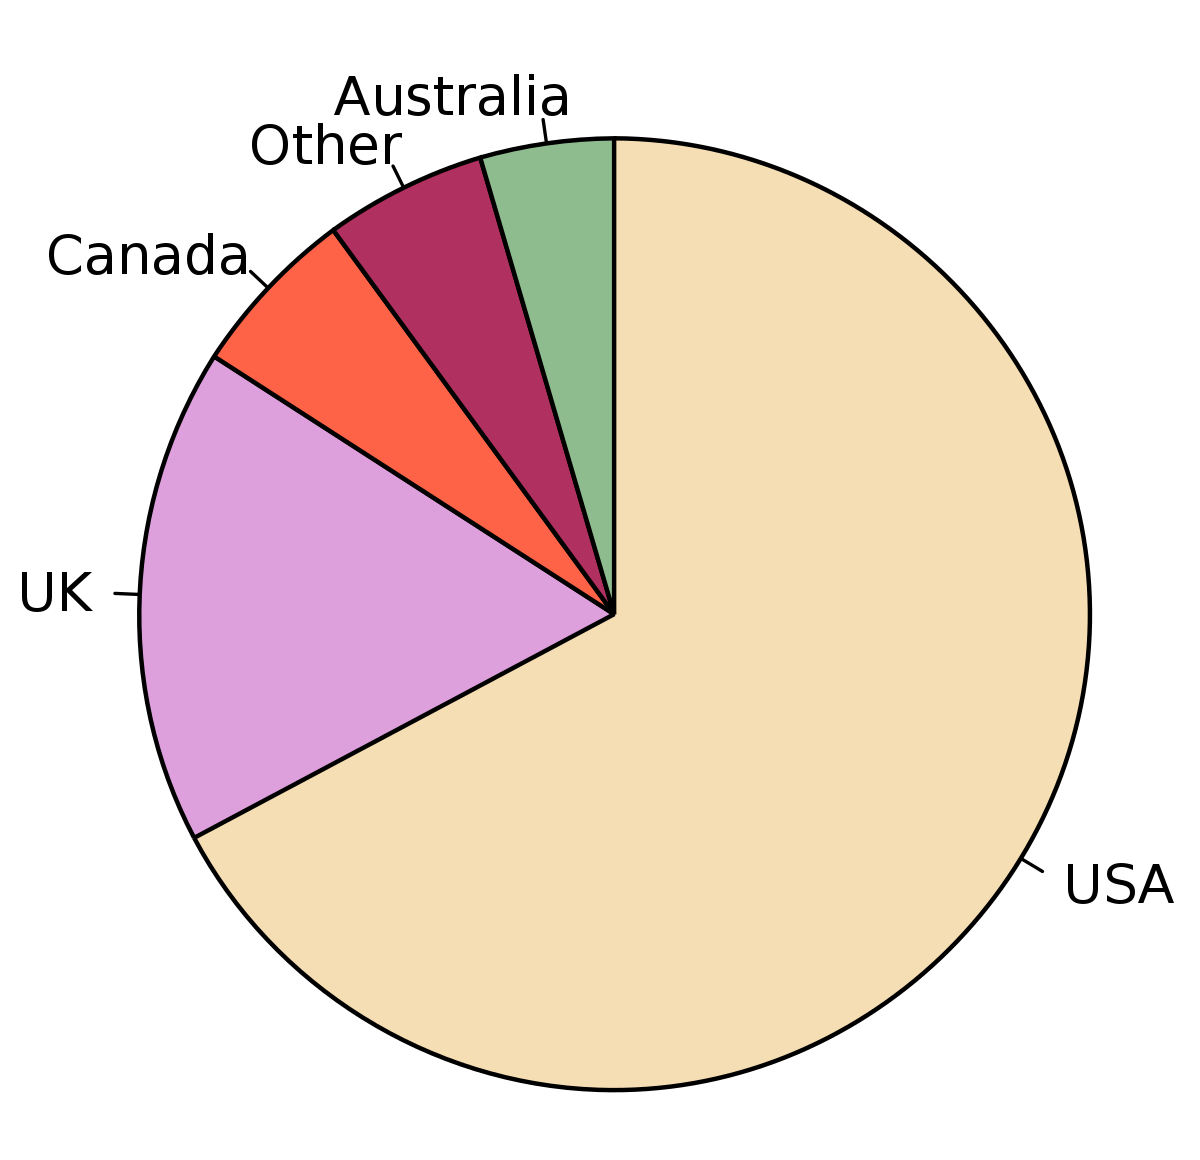
E. Pie Chart: Another frequently used chart is the old pie chart. A pie chart represents the distribution or proportion of each data item over a total value (represented by the overall pie). A pie chart is most effective when plotting no more than three categories of data,
F. Bar Chart: Bar charts are typically used to compare several categories of data. Bar charts are ideal for visualizing the distribution or proportion of data items when there are more than three categories. For instance a bar chart could be used to compare the overall revenue distribution for a given set of products.
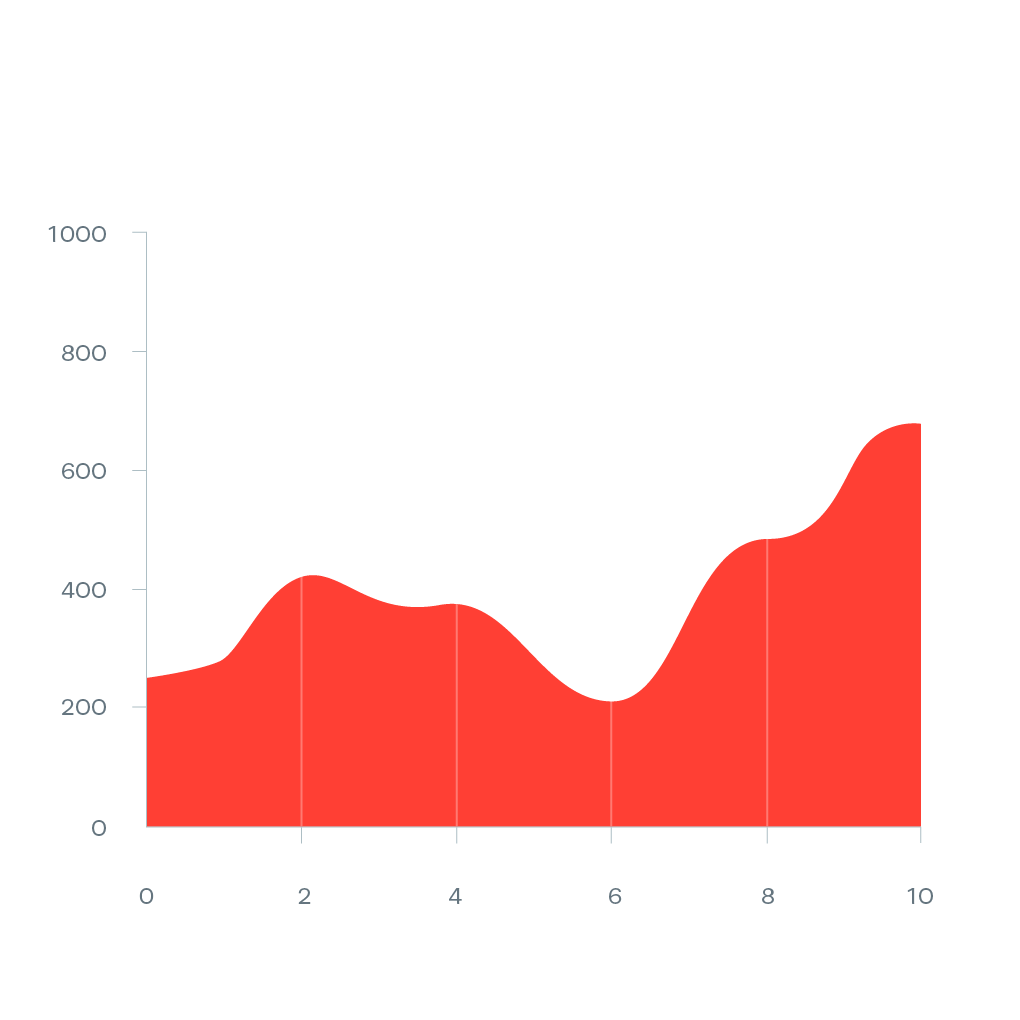
G. Area Chart: Area charts are ideal for clearly illustrating the magnitude of change between two or more data points. For example, you can give your audience a visual feel for the degree of variance between the high and low price for each month.
H. Bubble Chart: A bubble chart is a variation of an XY scatter plot. Just like the XY scatter plot, bubble charts show the correlation between two sets of data. The difference is the addition of a third dimension that is represented by the size of each bubble in the chart. This third dimension is typically used to show the relative impact of a quantitative data item.

Read more