Sampling Technique – In its most common sense, methodology is the study of research methods. However, the term can also refer to the methods themselves or to the philosophical discussion of associated background assumptions. A method is a structured procedure for bringing about a certain goal, like acquiring knowledge or verifying knowledge claims. This normally involves various steps, like choosing a sample, collecting data from this sample, and interpreting the data. The study of methods concerns a detailed description and analysis of these processes. It includes evaluative aspects by comparing different methods.
In this way, their benefits and drawbacks are evaluated, as well as the research goals for which they may be used. These descriptions and evaluations are predicated on philosophical background assumptions; examples include how to conceptualize the phenomena under study and what constitutes evidence in favor of or against them. In its broadest sense, methodology encompasses the discussion of these more abstract issues.
Sampling Technique
Definition of sampling
According to Hurlock:
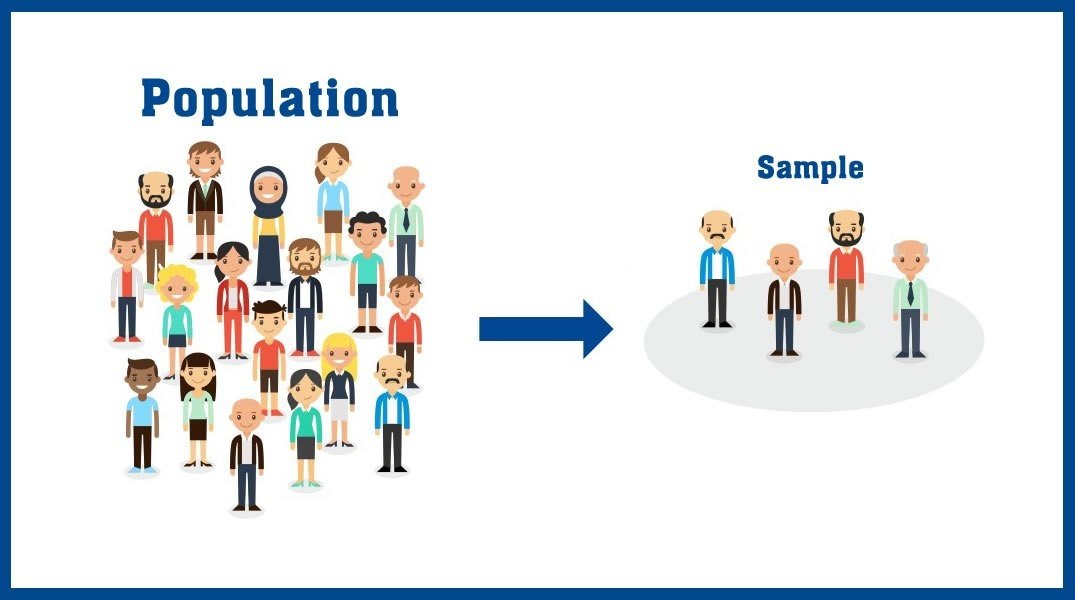
“Sampling is the process of selecting, representing units of a population for the study or research.”
According to Chris Jordan:
“Sampling is the process of selecting a subset of a population in order to obtain information regarding phenomena in a way that represents the entire population.”
(Ref by- Seenidurai Paulraj/Introduction to Nursing Research/1″/77)
Types of sampling Techniques/Methods of Sampling
There are mainly two types/methods of sampling. The following types are-
1. Probability sampling/Chance sampling/Random sampling.
2. Non-Probability sampling.
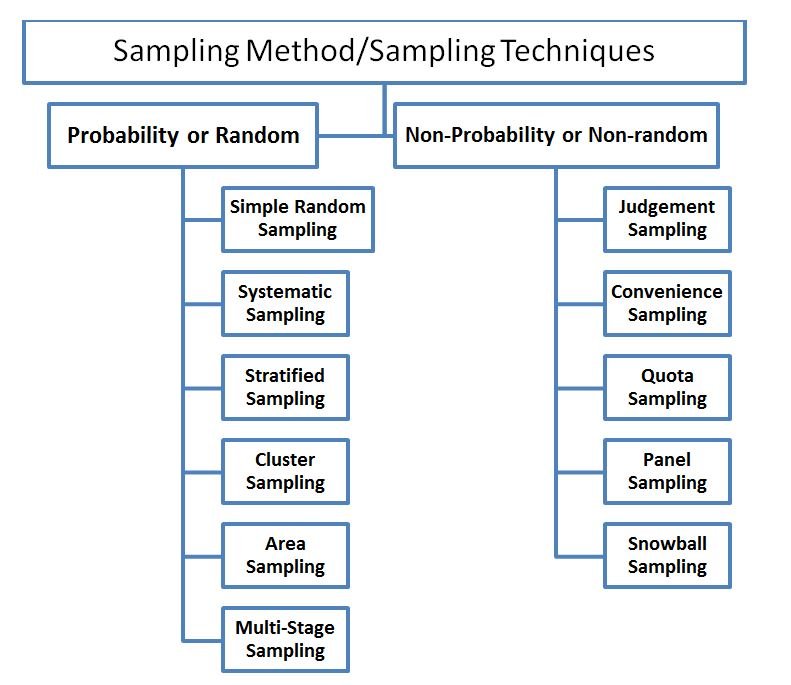
Probability sampling:
➤ Simple random sampling:
- This method is applicable when the population is small, homogenous and readily available.
- The simple is drawn in such a way that each unit has an equal chance of being drawn in the sample.
- So, this method is also called unrestricted random sampling. To ensure randomness of selection, lottery method or table of random number can be adopted.
➤ Systemic sampling:
- In a systemic sampling, the selection of the first unit is made at random and subsequent units are selected at certain interval.
➤ Stratified sampling:
- The sample is deliberately drawn in a systemic way so that each portion of the sample represents a corresponding stratum of the universe.
- This method is particularly useful where one is interested in analyzing the data by a certain characteristics of the population, muslims, hindu, Christian.
➤ Multistage sampling:
- This method refers to the sampling procedures carried out in several stages using random sampling techniques.
➤ Cluster sampling:
- A cluster is a randomly selected group. This method is used when units of population are natural group or clusters such as villages, wards, blocks, slums of a town, factories, workshops or children of a school etc.
➤Multiphase sampling:
- In this method, part of the information is collected from the whole sample and part from sub-sample.

Non-probability sampling:
➤ Deliberate /Judgment/purposive Sampling:
- In this method, items for the sample are selected deliberately by the researcher, his choice concerning the items remains supreme.
➤ Quota sampling:
- Under quota sampling the interviews are simply given quota to be filled from the different strata, with some restriction on how they are to be filled.
➤ Convenience/Accidental sampling:
- When the sample is collected without the intension of the researcher to collect the sample of that occasion.
(Ref by- B.K Mahajan/6/96)
Characteristics of a Good Sampling Design
The characteristics of a good sampling design are as follows
- A good sample is one, which within restrictions imposed by its size, will reproduce the characteristics of the population with the greatest possible accuracy
- It should be free from error due to bias or due to deliberate selection of the unit of the Sample
- It should be free from random sampling error
- There should not be any substitution of originally selected unit by some other more convenient way
- It should not suffer from incomplete coverage of the units selected for the study, i.e. it should not ignore the failure in the sample in responding to the study
- In the sample, only such units should be included, which as Far as possible, are independent
- While constructing a sample, it is important that measurable or known probability A sample technique is used, this will substantially reduce the likely discrepancies
- Relatively small samples properly selected may be much more reliable than large samples poorly selected. But at the same time, it is very essential that the sample is adequate in size, so that it can become more really reliable.
(Ref by- Seenidurai Paulraj/Introduction to Nursing Research/1″/78)
Advantages Of Sampling
- Economy in expenditure
- Economy in time
- Greater scope
- Greater accuracy
- Organization of convenience
- Intensive and exhaustive date
- Suitable in limited resources
- Better report
Disadvantages of Sampling
- Chances of bias
- Difficulty in getting representative sample
- Need for specialized knowledge
- Changeability of units
- Impossibility of sampling
(Ref by- Seenidurai Paulraj/Introduction to Nursing Research/1/89)
Difference between Probability Sampling and Non-Probability Sampling Methods
| Probability Sampling Methods | Non-Probability Sampling Methods | |
| Definition | Probability Sampling is a sampling technique in which sample from a larger population are chosen using a method based on the theory of probability. | Non-probability sampling is a sampling technique in which the researcher selects samples based on the subjective judgment of the researcher rather than random selection. |
| Alternatively Known as | Random sampling method. | Non-random sampling method |
| Population selection | The population is selected randomly. | The population is selected arbitrarily. |
| Market Research | The research is conclusive in nature. | The research is ‘exploratory in nature. |
| Sample | Since there is method to deciding the sample, the population demographics is conclusively represented. | Since the sampling method is arbitrary, the population demographics representation is almost always skewed. |
| Time Taken | Take a longer time to conduct since the research design defines the selection parameters before the market research study begins. | This type of sampling method is quick since neither the sample or selection criteria of the sample is undefined. |
| Results | This type of sampling is entirely unbiased and hence the results are unbiased too and conclusive. | This type of sampling is entirely biased and hence the results are biased too rendering the research speculative. |
| Hypothesis | In probability sampling, there is | In non-probability sampling, the |
| an underlying hypothesis before the study begins and the objective of this method is to prove the hypothesis. | hypothesis is derived after conducting the research study.
|
Use of the Probability Sampling Method
There are multiple uses of the probability sampling method. They are:
1. Reduce Sample Bias: Using the probability sampling method, the bias in the sample derived from a population is negligible to non-existent. The selection of the sample largely depicts the understanding and the inference of the researcher. Probability sampling leads to higher quality data collection as the population is appropriately represented by the sample.
2. Diverse Population: When the population is large and diverse, it is important to have adequate representation so that the data is not skewed towards one demographic. For example, if Square would like to understand the people that could their point-of-sale devices, a survey conducted from a sample of people across US from different industries and socio-economic backgrounds, helps.
3. Create an Accurate Sample: Probability sampling helps the researchers plan and create an accurate sample. This helps to obtain well-defined data.
Use of the Non-Probability Sampling Method
There are multiple uses of the non-probability sampling method. They are:
1. Create a hypothesis: The non-probability sampling method is used to create a hypothesis when limited to no prior information is available. This method helps with immediate return of data and helps to build a base for any further research.
2. Exploratory research: This sampling technique is widely used when researchers aim at conducting qualitative research, pilot studies or exploratory research.
3. Budget and time constraints: The non-probability method when there are budget and time constraints and some preliminary data has to be collected. Since the survey design is not rigid, it is easier to pick respondents at random and have them take the survey or questionnaire.
Data
Definition of Data:
Data is a collection of facts, such as numbers, words, measurements, observations or even just descriptions of things.
Or
Data may be defined as “Information in raw or unorganized form (such as alphabets, numbers, or symbols) that refer to, or represent, conditions, ideas, or objects. Data is limitless and present everywhere in the universe. See also information and knowledge.’
Classification of Data:
A. On the basis of source:
➤ Primary data: Data that is obtained directly from an individual, object or phenomenon is called primary data.
Example:
- The census of 2011 is an example of collection primary data relating to the population.
- The collection of data about the health and sickness of a population is primary data,
➤ Secondary data: Data that is obtained from outside source is called secondary data.
Example:
- Hospital records.
- Previous surveys.
- Professional journal etc.
➤ Tertiary data: Data that is obtained from text book.
B. On the basis of nature:
➤ Quantitative: Data which have a magnitude.
- Example: Weight of person.
➤ Qualitative: Data which have no magnitude or size,
- Example: Male, Female; Vaccinate, Not Vaccinate; Anaemic, Not Anaemic Etc.
C. Other classification:
➤ Continuous data: A continuous data is one which can have an infinite number of possible values in any give interval. e.g. Height in cm. here fractions possible.
➤ Discrete data: A discrete value is one which can have only finite number of value in any given interval. e.g. Number of hospital bed. Here fraction is not possible.
(Ref by-C.R kothary/24/115)
Definition of Information:
Information is the knowledge that can get about someone or something: feats or detail about a subject.
Or
Data become information when row data often collection are compiled, analyzed & organized for meaningful expression or presentation.
[Ref-Dr.Md. Z.H.S/1″/6]
Methods of Information Or Data Collection:
Following methods should be used by the nurses-
- Physical appearance.
- Observation
- History taking related to health.”
- Physical examination.
- Interview
- Laboratory examination (test).
- Symptoms analysis,
- Investigation.
- Asking question to the members.
- Case Studies.
- Documents and Records.
Characteristic of Data:
- Data can be derived from total population a sample.
- Data can be grouped or ungrouped.
- Data can be discrete or continue.
- Data can be quantitative or qualitative.
- Data exists permanently
- Data is not at all repeated.
- Data must be very much correct in the nature,
- Data can live beyond the scoped of the process that has created it.
[Lecture + VIRUS/1/196]
Principles/Guideline for Data Collection:
Principle/guidelines/Rules of data collection:
- Data should be accurate for the intended use.
- Data should be valid and that is intended to be measured.
- Data should be reliable and stable.
- Data should be relevant the question for which it is addresses.
- It should be completeness.
- Limitation of the date should be carefully
- Data Collection methods should be Free of gender ethnic, economic status and other possible bias.
[Ref-K.park 24]
Subjective Data:
Subjective data are information from the client’s point of view (“symptoms”), including feelings, perceptions, and concerns obtained through interviews. Examples of subjective data: Itching, pain, Feeling of worry etc.
Objective Data:
Objective data are observable and measurable data (“signs”) obtained through observation, physical examination, and laboratory and diagnostic testing. Objective data referred to as signs an accepted standard. Examples of objective data: Discoloration of the skin or a blood pressure.
The difference between data and information are as follows-
| Data | Information |
| Data is raw materials of collected information are called data or these are information, which are obtained by careful observation of attribute or events. | Information implies informing or disseminating scientific knowledge about hesith to the people and also collection information from the people. |
| Data as collected from operating health care systems or institutions are adequate for planning. | It is not so |
| Data need to be transformed into information by reducing them, summarizing them and adjusting them for variations. | Information is not transformed into data for analysis. |
| Data that are not transformed into. information are of little value. | It is not such. |
Steps of Data Analysis Interpretation/ Processing:
Following mayor steps are required
1. Identify abnormal data and strengths.
2. Cluster the data.
3. Draw inferences and identify problems.
4. Propose possible nursing diagnosis. 5. Cheek defining characteristics.
6. Confirm or rule out.
7. Document conclusions.
Sources of Data:
A. On the basis of nursing practice:
- At home- Family members, practice.
- At school-School teachers, friends
- At hospital-Doctors, nurses
- At health center- Health care provider
- At clinic-Physicians, nurses
- At rehabilitative center – multidisc culinary teams
- Observation/physical examination- exception- palpation- percussion- Auscultation.
B. On the basis of epidemiology and biostatistics:-
1. Primary sources of data:
- Raw data-original research; eg. Journal articles, books.
- Daily entries, letters and other correspondence
- Photographs- legal documents
- Audio & video broad cast
- Eyewitness account or interview
- Records and documents created by organizations.
2. Secondary data: At builds upon primary resources by analyzing, interpretation synthesizing or discussing them.
Example:
- Book Journal articles
- Gray literatures
- Newspapers- popular magazines
- Movie reviews Articles Found in Scholarly
- Biographies-historical studies Journals.
3. Tertiary sources: overcool of topics digestion primary & secondly sources into summarizes of information,
Example: Encyclopedias
- Textbook- Almanacs.
- Chronologies- Handbooks.
- Biographical dictionaries
- Subject dictionaries